PCA 题库
Prometheus Certified Associate(PCA)
- Which one of the following item should not belong to metric?
- username ✅
- response code
- environment
- Server name
- How can we add Service Discovery labels to targets?
- Via honor_labels.
- Via federation.
- Via metric_relabel_configs.
- Via relabel_configs ✅.
- Which of following is used to push metrics to Prometheus?
- Exporter
- Node Exporter
- Pullgateway
- Pushgateway ✅
- How does Prometheus help trouybleshoot performance degradation?
- Prometheus provides long term storage. ✅(?)
- Prometheus provides an easy GUI for events/messages search.
- Prometheus signidicantly simplifies tracing and application debugging.
- Prometheus stores detailed metrics and counters.
- A Service level Objective(SLO) is:
- an agreement whithin an SLI about a specific measurement.
- an agreement between provider and client.
- a goal whithin an SLA about a specific metric like response time. ✅
- an agreement whithin an SLI about a specific indicator.
- Which tool provides the answer to question: “ What was our 99.9% response time last month”**?**
- SLI’s
- Error budget.
- SLO’s ✅
- SLA’s
- What is a trace**?**
- Trace is a numerical measurement about a service,captured at runtime.
- Trace is a set of events triggered by a single logical operation,consolidated across various components of an application.✅
- Trace is a simple mechanism for propagating name/value pairs.
- Trace is a timestamped text record,either structured(recommended) or unstructured,with metadata.
- What metric represents a single numerical value that can arbitrarily go up and down?
- counter
- summary
- gauge ✅
- histogram
- What are the changes in numerical data recorded over time called?
- time table
- time series ✅
- data dashboard
- metrics
- An SLI is a service level indicator defined as a(n)__measure of some aspect of the level of service that is provided?
- ephemeral
- quantitative ✅
- significant
- qualitative
- You’d like get alerts when one of your production Linux servers goes down. What Prometheus components woild you use?
- Prometheus server,alert exporter,server manager
- Kubernetes,Prometheus server,Grafana
- Prometheus server,node exporter,alert manager ✅
- Push Gateway,node manager,Prometheus server
- What is defference beween a counter and a gauge?
- Counters ard only incremented,while gauge can go up and down. ✅
- Counters and gauges are different names for the same thing.
- Counters change value on each scrape and gauges remain static.
- Counters have no labels while gauges can have many labels.
- How can you use the **Prometheus federation**?
- You can use the federation to change metric labels in the Prometheus server.
- You can use the federation to scrape selected time series from another Prometheus server. ✅
- You can use the federation to control scraping jobs in another Prometheus server.
- You can use the federation to probe applications from the Prometheus server.
- You’d like monitor a short lived batch job. What **Prometheus component would you use**?
- PullGateway
- PushGateway ✅
- PullProxy
- PushProxy
- What dose _scrapeinterval configure in **Prometheus**?
- It defines how frequently to evaluate rules.
- It defines how frequently to scrape targets. ✅
- It defines how often to send alerts.
- It defines how often to refresh metrics.
- Which of the following metric is unsuitable for **Prometheus setup**?
- user_last_login_timestamp_seconds{email="john.doe@example.com"}
- http_response_total{handler="/static/*filepath"}
- prometheus_engine_query_log_enabled
- Prohttp_metric_handler_requests_total{code="500"} ✅
- What is the requirement to use the /-/reload HTTP endpoint to reload Prometheus configuration file?
- Start Prometheus with --web.enable-lifecycle ✅
- Send a SIGHUP signal to Prometheus
- Start Prometheus with --web.enble-admin-api
- Add enable_reloads: true to the configuration file
- What is** api_http_requests_total** in the following metric?
api_http_requests_total{method="POST", hander="/messages"}
- "api_http_requests_total" is metric name. ✅
- "api_http_requests_total" is metric type.
- "api_http_requests_total" is metric label name.
- "api_http_requests_total" is metric field.
- Which mechanism can be used to automatically adjust the amount of resources for an application?
- You configure retention for all metrics via Prometheus command-line flags. ✅
- You configure retention for each scraping job in the Prometheus command-line flags.
- You configure retention for each service-discovery instance in the Prometheus configuration file.
- Metric retention is configured in the Prometheus configuration file.
- Prometheus fundamentally stores all data as _____**?**
- input-output
- artificial neural network
- simultaneous equations
- time series ✅
- Which of the following filesystems is unsupported by **Prometheus**?
- NFS ✅
- NTFS
- ext4
- XFS
- Which PromQL expression computes how many requests in total are currently in-flight for the following time series data?
apiserver_current_inflight_requests{instance="1"} 5
apiserver_current_inflight_requests{instance="2"} 7
- min(apiserver_current_inflight_requests)
- sum_over_time(apiserver_current_inflight_requests[10m]) ✅
- sum(apiserver_current_inflight_requests[10m])
- max(apiserver_current_inflight_requests[10m])
- What is the difference between rate and irate?
- rate takes a range vector as argument.irate takes an instant vector as argument.
- rate is valid PromQL function.irate doesn’t exist in PromQL.
- rate for counter metrics,and irate is for gauge metrics.
- rate uses all the samples.irate only uses last 2 samples of the range selector. ✅
- With the following metrics over the last 5 minutes:
up{instance="localhost"} 1 1 1 1 1
up{instance="server1"} 1 0 0 0 0
What does the following query return: min_over_time(up[5m])?
-
up{instance="server1"} 0
-
{instance="localhost"} 1 ✅
{instance="server1"} 0
-
up{instance="localhost"} 1
up{instance="server1"} 0
-
{instance="server1"} 0
-
How do you calculate the averange request duration during the last 5 minutes a histogram or summary called http_request_duration_seconds?
-
rate(http_request_duration_seconds_total[5m])/rate(http_request_duration_seconds_count[5m])
-
rate(http_request_duration_seconds_sum[5m])/rate(http_request_duration_seconds_average[5m])
-
rate(http_request_duration_seconds_sum[5m])/rate(http_request_duration_seconds_count[5m]) ✅
-
rate(http_request_duration_seconds_total[5m])/rate(http_request_duration_seconds_average[5m])
-
How many different metric names can be produced by a histogram?
-
2,with suffixes _sun and _count.
-
3,with suffixes _sun ,_count and _bucket. ✅(? 应该是 _sum)
-
3,with suffixes _sun ,_count and _quantile.
-
2,with suffixes _sum and _le.
-
Which of the following expressions selects the value of metric go_goroutines for the label instance with value localhost:9090 and job with value prometheus?
-
go_goroutines [ instance="localhost:9090" job="prometheus" ]
-
go_goroutines { instance="localhost:9090", job="prometheus" } ✅
-
go_goroutines [ instance="localhost:9090", job="prometheus" ]
-
go_goroutines { instance="localhost:9090" job="prometheus" }
-
Which of the following statements is NOT correct?
-
Histogram metrics are aggregatable.
-
Summary metrics are aggregatable.
-
Summary metric type is computed on the client-side.
-
Histogram metric type is computed on the server-side. ✅
-
What function calculates the **φ**-quantile from a histogram?
-
avg_over_time()
-
histogram()
-
predict_linear()
-
histogram_quantitle() ✅
-
Which of the following expressions selects all the values of a metric "up" in the last 5 minutes?
-
up@5m
-
up[5m] ✅
-
up for 5m
-
up offset 5m
-
Which of the following is an invalid **@modifier** expression?
-
go_goroutines @end()
-
sum(http_requests_total{method="GET"}) @1609746000 ✅
-
sum(http_requests_total{method="GET"} @1609746000)
-
go_goroutines @start()
-
What dose thefollowing PromQL query return?
sum(up)/count(up)
Give the following metrics:
up{instance="localhost"} 1
up{instance="server1"} 0
-
up 0.5
-
{instance="localhost"} 1
{instance="server1"} 0
-
{instance="localhost"} 1
{instance="server1"} NaN
-
{} 0.5 ✅
-
if the vector selector foo[5m] contains 1 1 NaN 0,what would max_over_time(foo[5m]) return?
A. It errors out.
B. No answer.
C. 1 ✅
D. NaN
- How canyou see the timestamp of collected samples in PromQL?
- With the time() function.
- With the timestamp() function. ✅
- This data is not available via PromQL.
- With the a query that includes the last_scrape_timestamp_seconds metric.
- Which expression calculates the average uptime od targets over the last hour?
- avg(up-1h)
- avg(up[1h])
- average_over_time(up[1h])
- avg_over_time(up[1h]) ✅
- Which of the following PromQl query is invalid?
- max without (instance, job) up
- max without (instance) up
- max on (instance) (up) ✅
- max by (instance) up
- Which metric type uses the delta() function?
- Info
- Gauge ✅
- Histogram
- Counter
- Which PromQL statement returns the average free bytes of the filesystems over the last hour?
- sum_over_time(node_filesystem_avail_bytes[1h])
- avg(node_filesystem_avail_bytes[1h])
- sum(node_filesystem_avail_bytes[1h])
- avg_over_time(node_filesystem_avail_bytes[1h]) ✅
- Which of the following is valid time duration in PromQL?
- 1H30
- 1w ✅
- 5min
- 3600
- How can you use Prometheus blackbox_exporter?
- You can use it to collect metrics from the node.
- You can use it to collect resource metrics from the application.
- You can use it to probe endpoint over HTTP,HTTPS,and other protocols. ✅
- You can use it to instrument applications with metrics.
- Which function is available on gauges and counters?
- Set
- Decrease
- Increase ✅
- Substract
- What is a Prometheus registry?
- A registry is a set of erxporters install in your infrastructure to expose metric.
- A registry is a collection of targets for the same job,which can be connected to Prometheus using HTTP service discovery.
- A registry is a set of defined metrics a client library exposes to Prometheus.✅
- A registry is a protocol collect TLS keys to secure metrics collection from your application to Prometheus server.
- What exporter enables monitoring of Linux machines?
- pushgateway
- linux_exporter
- host_exporter
- node_exporter ✅
- What exporter would you use to monitor network routers,switches,or printers?
- XMPP Exporter
- SCTP Exporter
- SNMP Exporter ✅
- SMTP Exporter
- What is a Prometheus client library?
- It is a library to convert from the OpenMetrics format to the Prometheus format.
- It is a library to extract metrics from existing exporters.
- It is a library to send metrics to remove write endpoints.
- It is a library to instrument your application with Prometheus metrics. ✅
- How would you correctly name a metric that provides metadata information about the binary?
- app_build_desc
- app_metadata
- app_build_info ✅
- app_build
- What is the preferred unit for time duration in **Prometheus**?
- It depends on the scale
- seconds
- milliseconds ✅
- nanoseconds
- How would you name a metric that tracks HTTP request duration?
- http_request_duration_seconds ✅
- http_request_duration
- http_request_latency
- request_duration_seconds
- Which receiver will get an alert when the following alert is firing?
Labels:
- alertname = MongoDBErrorWarning
- severity = warning
- cluster = ops
- service = mangodb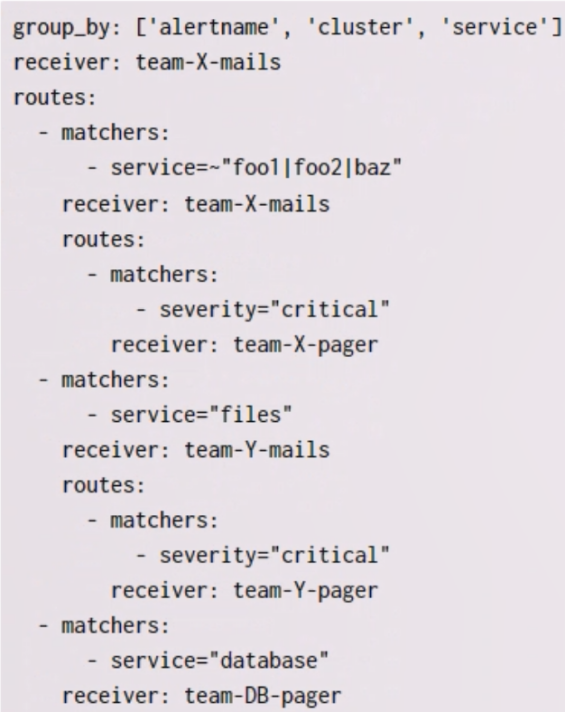
- team-X-mail
- team-X-pager
- team-Y-pager
- team-Y-mails ✅
- What popular Open Source project is commonly used to visualize Prometheus data?
- Visual Studio Code
- Grafana ✅
- Alert Manager
- Kubernetes Dashboard
- What is Inhibition?
- The concept of suppressing notification for some alerts if other specified alerts are already firing. ✅
- The Alertmanager support for a special configuration to create a cluster for high availability.
- A way to categorize alerts of similar nature info a single notification.
- A straigghtforward configuration to mute alerts for a given time.
- What is considered the best practice when working with alerting notifications?
- Have as few alerts as possible by alerting only when symptoms might become externally visible.
- Have as many alerts as possible to catch minor problems before they become outages.
- Make sure to generate alerts on every metric of every component of the stack.
- Minor alerts are as important as major alerts and should be treated with equal care. ✅
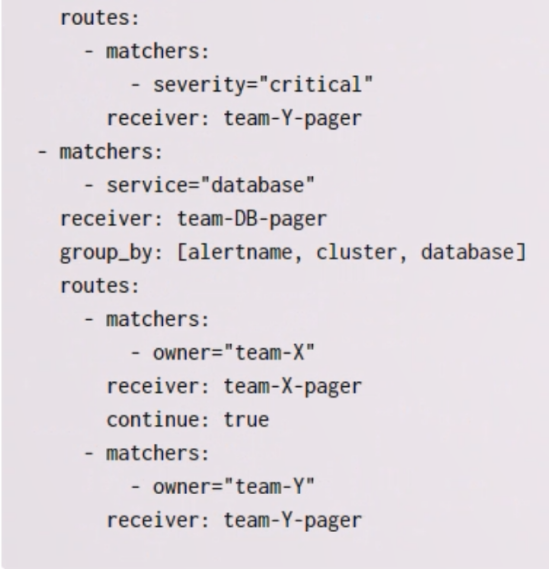
- which receiver will get an alert when the following alert is firing?
Labels:
- alertname = ApplicationIsDown
- severity = critical
- cluster = ops
- service = baz
Given the following Alertmanager configuration: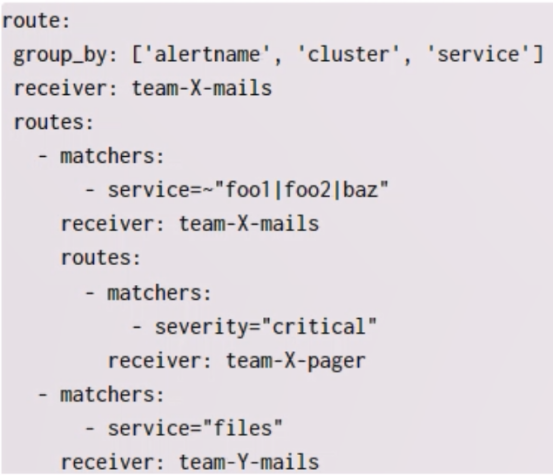
- team-X-mail
- team-X-pager ✅
- team-Y-pager
- team-Y-mails
- What are Inhibition rules?
- Inhibition rules inspect alerts when a matching set of alerts is firing.
- Inhibition rules repeat a set of alerts when another matching alert is firing.
- Inhibition rules mute a set of alerts when another matching alert is firing.✅
- Inhibition rules inject a new set of alerts when a matching alert is firing.
- What can be configured when creating a Prometheus data source in Grafana?
- You can configure the avaluation interval.
- You can configure the alerting interval.
- You can configure the scrape interval. ✅
- You can configure the retention interval.
- What is metamonitoring?
- Metamonitoring is monitoring that covers 100% of a service.
- Metamonitoring is monitoring of the monitoring infrastructure. ✅
- Metamonitoring is monitoring social networks for end user complains about quality of service.
- Metamonitoring is the monitoring of non-IT systems.
- When can you use the Grafana Heatmap panel?
- You can use it to graph a gauge metric.
- You can use it to graph a histogram metric. ✅
- You can use it to graph a counter metric.
- You can use it to graph an info metric.
- What is the difference between a symptom and a cause?
- Causes happen before symptoms.
- Symptoms are about end users impact,causes are technical issues. ✅
- Symptoms can be ignored and are informational,unlike causes.
- Symptoms are not real issue,causes are more important.
- Which field in alerting rules files indicates the time an alert needs to go from pending to firing state?
- offset
- expr
- fire_after
- for ✅
- How would you add a text from the instance label to the alert’s description for the following alert?
alert: InstanceDown
expr: up == 0
for: 5m
labels:
serveriry: page
annotations:
description: "Instance INSTANCE_NAME_HERE down"
- Use $labels.instance instead of INSTANCE_NAME_HERE
- Use "labels.instance" instead of INSTANCE_NAME_HERE
- Use {{$labels.instance}} instead of INSTANCE_NAME_HERE ✅
- Use #labels.instance instead of INSTANCE_NAME_HERE